This is a short post presenting the great package semPlot developed by Sacha Epskamp (check out his nice website: http://sachaepskamp.com/) to make nice plots from your SEMs. SEMs are a modelling tool that allow the researcher to investiguate complex relationships between the variables, you may find here many links to free tutorials: http://www.structuralequations.org/. Here I present a few tricks to plot SEMs in R that I have been using but if you look at ?semPaths or ?qgraph you will see that there are many many options to tune your graphs that I will not present here.
 #loading the library
library(semPlot)
library(lavaan)
library(clusterGeneration) #this is to generate a positive definite covariance matrix
#simulate some data
set.seed(1222)
sig<-genPositiveDefMat("onion",dim=5,eta=4)$Sigma #the covariance matrix
mus<-c(10,5,120,35,6) #the vector of the means
data<-as.data.frame(mvrnorm(100,mu=mus,Sigma=sig)) #the dataset
names(data)<-c("CO2","Temp","Nitro","Biom","Rich") #giving it some names
#building an SEM with a latent variable
m<-'Abiot =~ CO2 + Temp + Nitro
Biom ~ Abiot
Rich ~ Abiot + Biom'
m.fit<-sem(m,data)
#the plot
#basic version, the what arguments specify what should be plotted, here we choose to look at the standardized path coefficients
semPaths(m.fit,what="std",layout="circle")
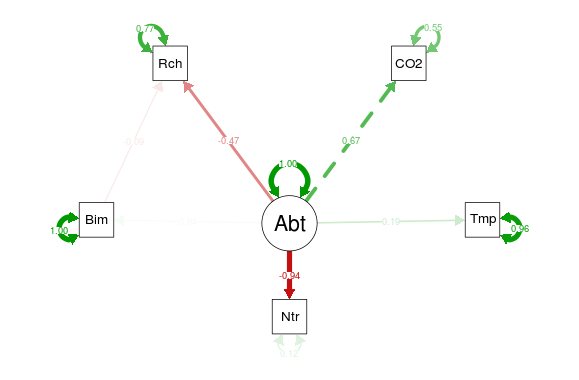
Here is just a basic version of the plots, many things can be changed, I will focus on the layout of the graph, the labels going into the nodes and the different groups of variables.
#define the label that will go into the nodes
lbls<-c("CO2\nconcentration","Temperature","Nitrogen\ncontent","Plant\nbiomass","Plant\nrichness","Abiotic\nenvironment")
#define the groups
grps<-list(Abiotic=c("CO2","Temp","Nitro","Abiot"),Plant=c("Biom","Rich"))
#define the layout
ly<-matrix(c(-0.5,-0.5,0,-0.5,0.5,-0.5,0,0.5,-0.5,0.5,0,0),ncol=2,byrow=TRUE)
#new plot
semPaths(m.fit,what="std",layout=ly,residuals=FALSE,nCharNodes=0,groups=grps,color=c("brown","green"),nodeLabels=lbls,sizeMan=8,posCol=c("blue","red"),edge.label.cex=1.5,legend=FALSE)
text(0.9,0.9,labels="Some text about\nthe model or\nthe weather in Indonesia")
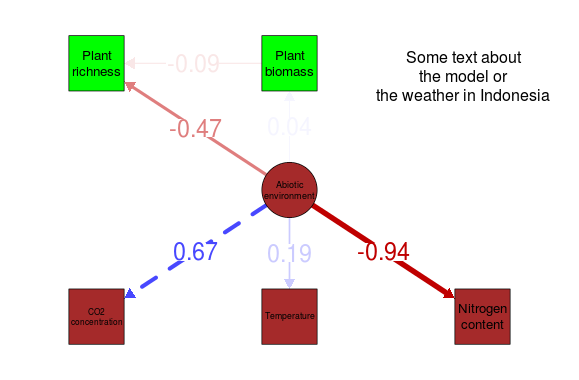
In this new plot I used the layout argument to specify my home-made layout, the plot is within a (-1,1)(-1,1) space and the position of each node can be specify using a 2 column matrix containing the X and Y position. To find out the order of the nodes and the edges one can do something like:
semPaths(m.fit,what="std",nodeLabels=letters[1:6],edgeLabels=1:12,edge.label.cex=1.5,fade=FALSE)
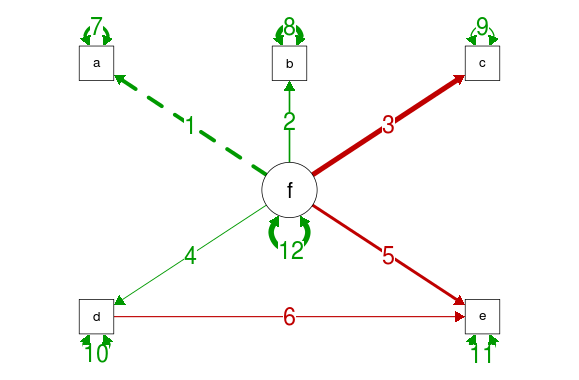
Using this knowledge we can define our own node labels using the nodeLabel argument (the \n is to add a line break in the label). Finally the groups argument need a list with character vectors of the different groups, each of the nodes belonging to the groups can get a particular color defined by color. sizeMan control the size of the nodes, posCol the color of the edges, when this is two colors the first one will be used for the positive edges and the second one for the negatives.
Again just by looking at the help pages of semPaths you will see much more ways to tailor your graphs to your need. Happy plotting.
